Solutions Bio-Signal IoT Platform
Bio-Signal IoT Platform
ECG, respiration, SpO₂, temperature and motion from inpatients' wearable patches, collected across the whole hospital in real time, with alarms, location, records and EMR integration in one web interface.
- Central monitors by ward, room and gateway, and a live window per patient
- Four-level alarms; patients, gateways and alarms on the hospital map
- Waveform storage with integrity seals; NAS/SFTP backup verified by SHA-256
- FHIR, HL7 v2 and Korean EMR integration; fine-grained permissions for eight roles
Two faces
- Hospital accounts (doctors, nurses, staff, IT managers): Patient Monitor
- Operator accounts (super admin, system admin, resellers, sales): Biomonitor Router
Screen demo
Key screens
In place of a live demo, 15 real screens walk through the main features. Use the previous and next buttons, the arrow keys or the strip below.
-
01 / 15
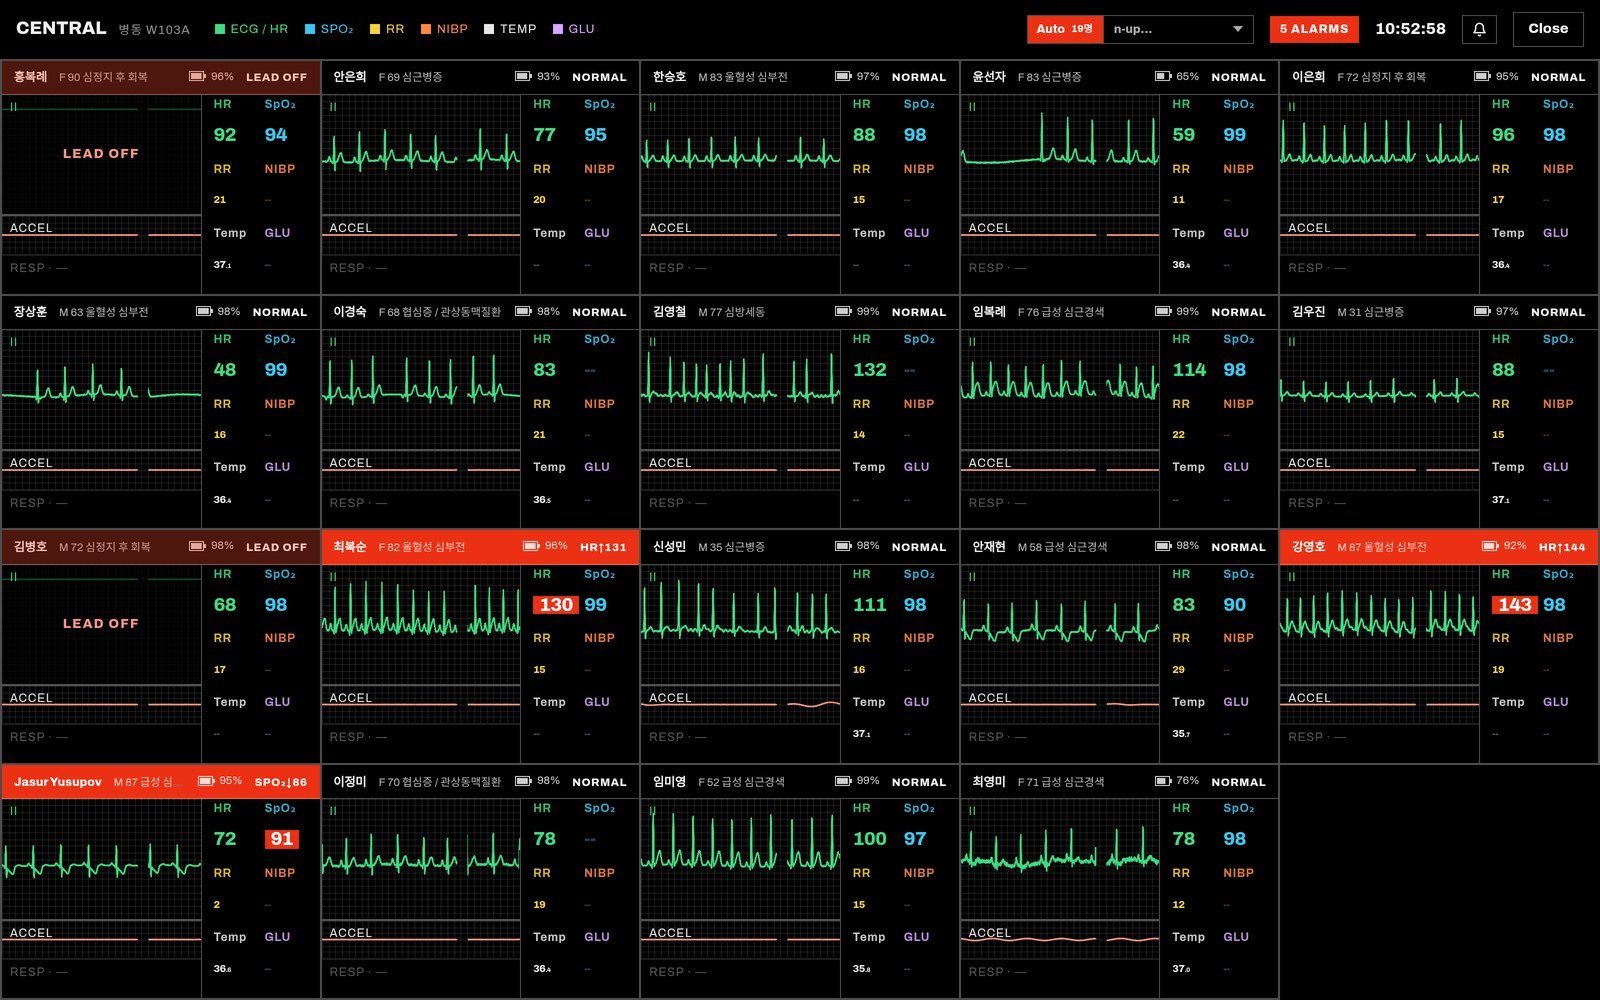
Central monitor
Patients grouped by ward, room, gateway or physician on one screen, with live ECG and heart rate, SpO₂, respiration rate and temperature.
- A patient in alarm turns the whole card to the alarm colour
- The grid resizes to the number of patients
- Full-screen mode for wall monitors
-
02 / 15
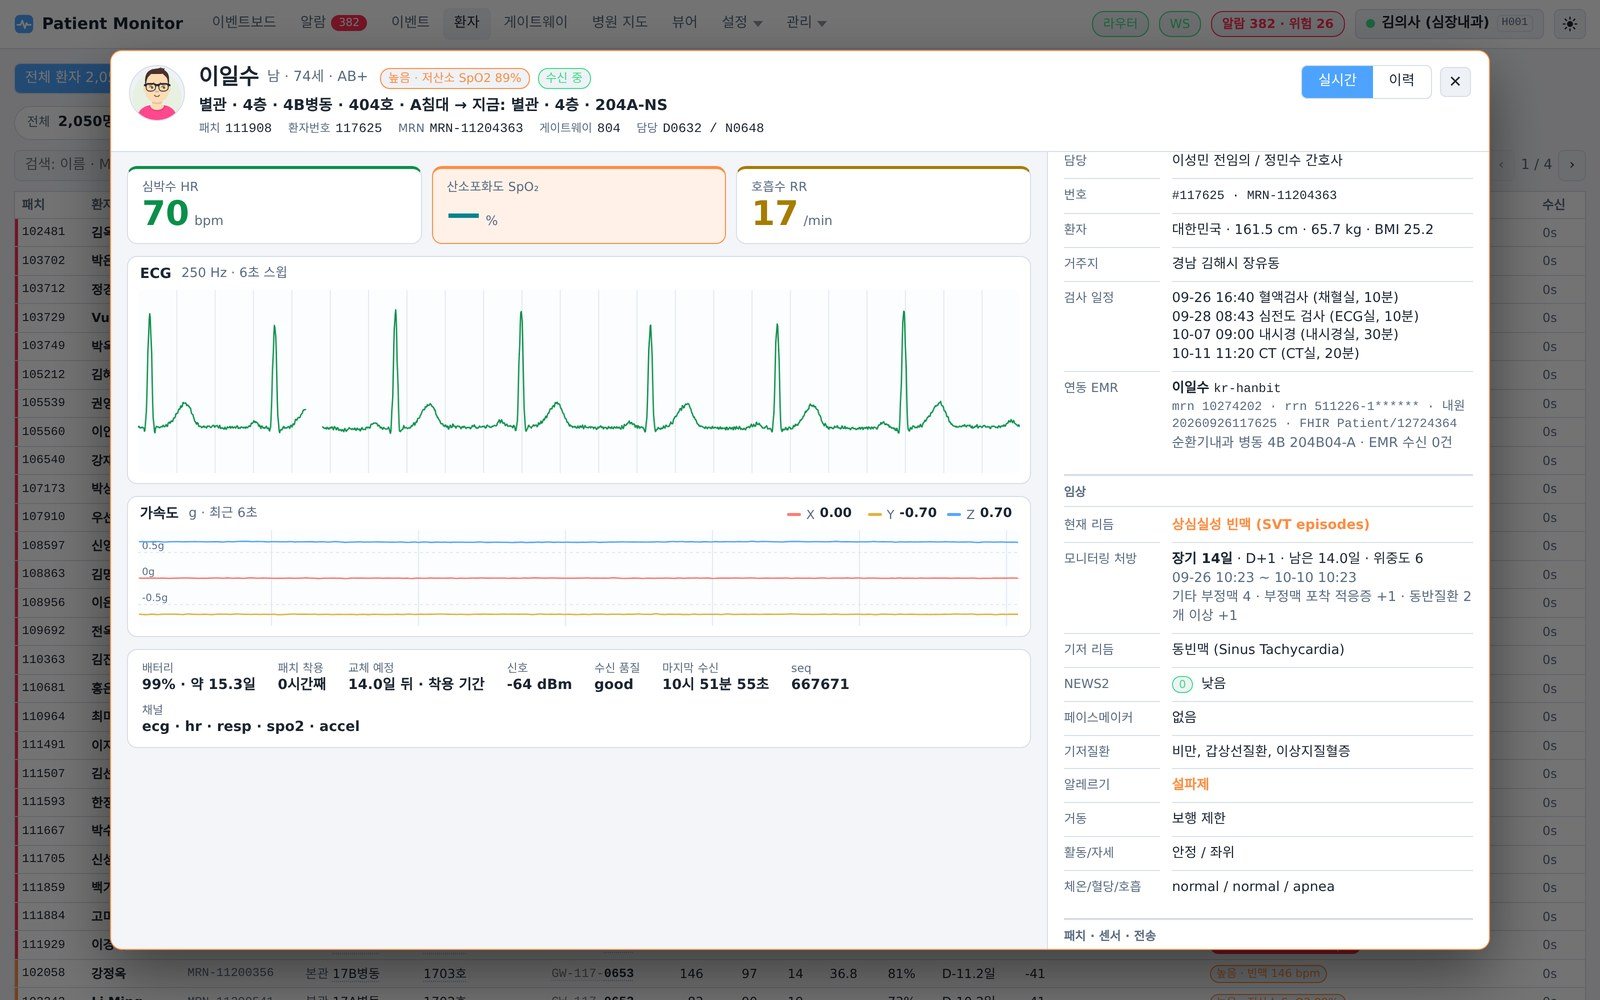
Patient live window
Clicking a patient icon or name opens live waveforms, vitals and patch status, with the admission record, clinical information, linked EMR and exam schedule alongside.
- ECG (250 Hz) sweep, 3-axis acceleration, vital tiles
- Patch battery days left, days worn, next replacement
- Item order adapts to the viewer's role
-
03 / 15
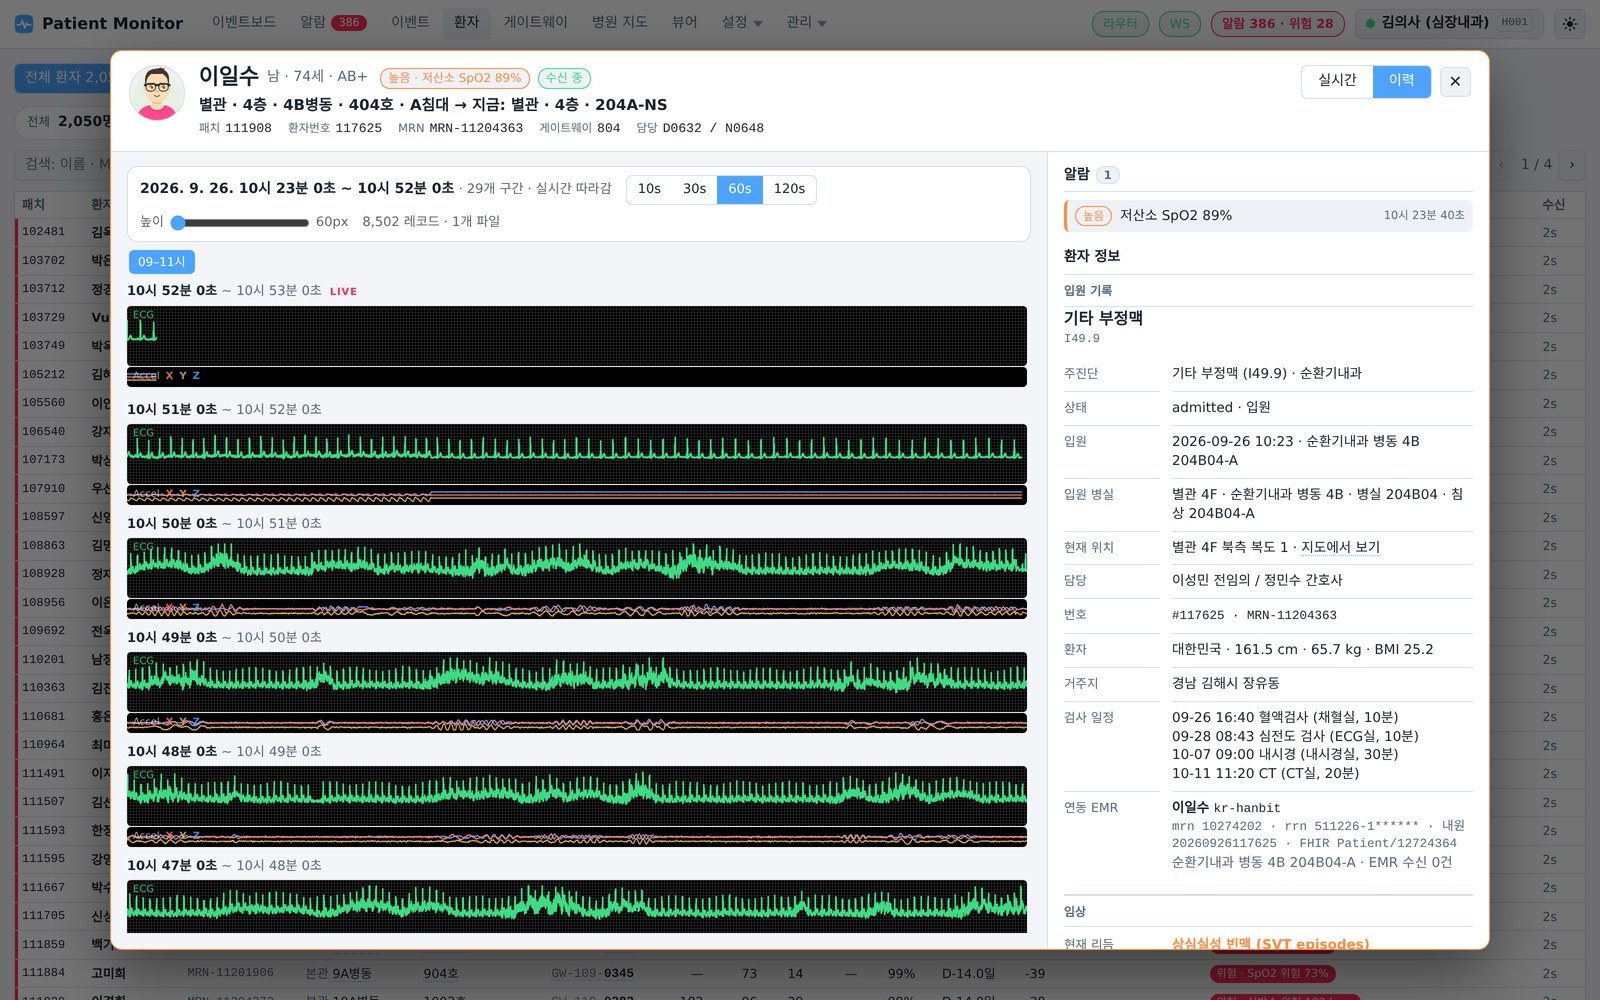
Waveform history
Step back through a patient's past waveforms in 10, 30, 60 or 120-second windows.
- Segments deleted locally are fetched from the backup server automatically
- Fetched data is verified with SHA-256
-
04 / 15
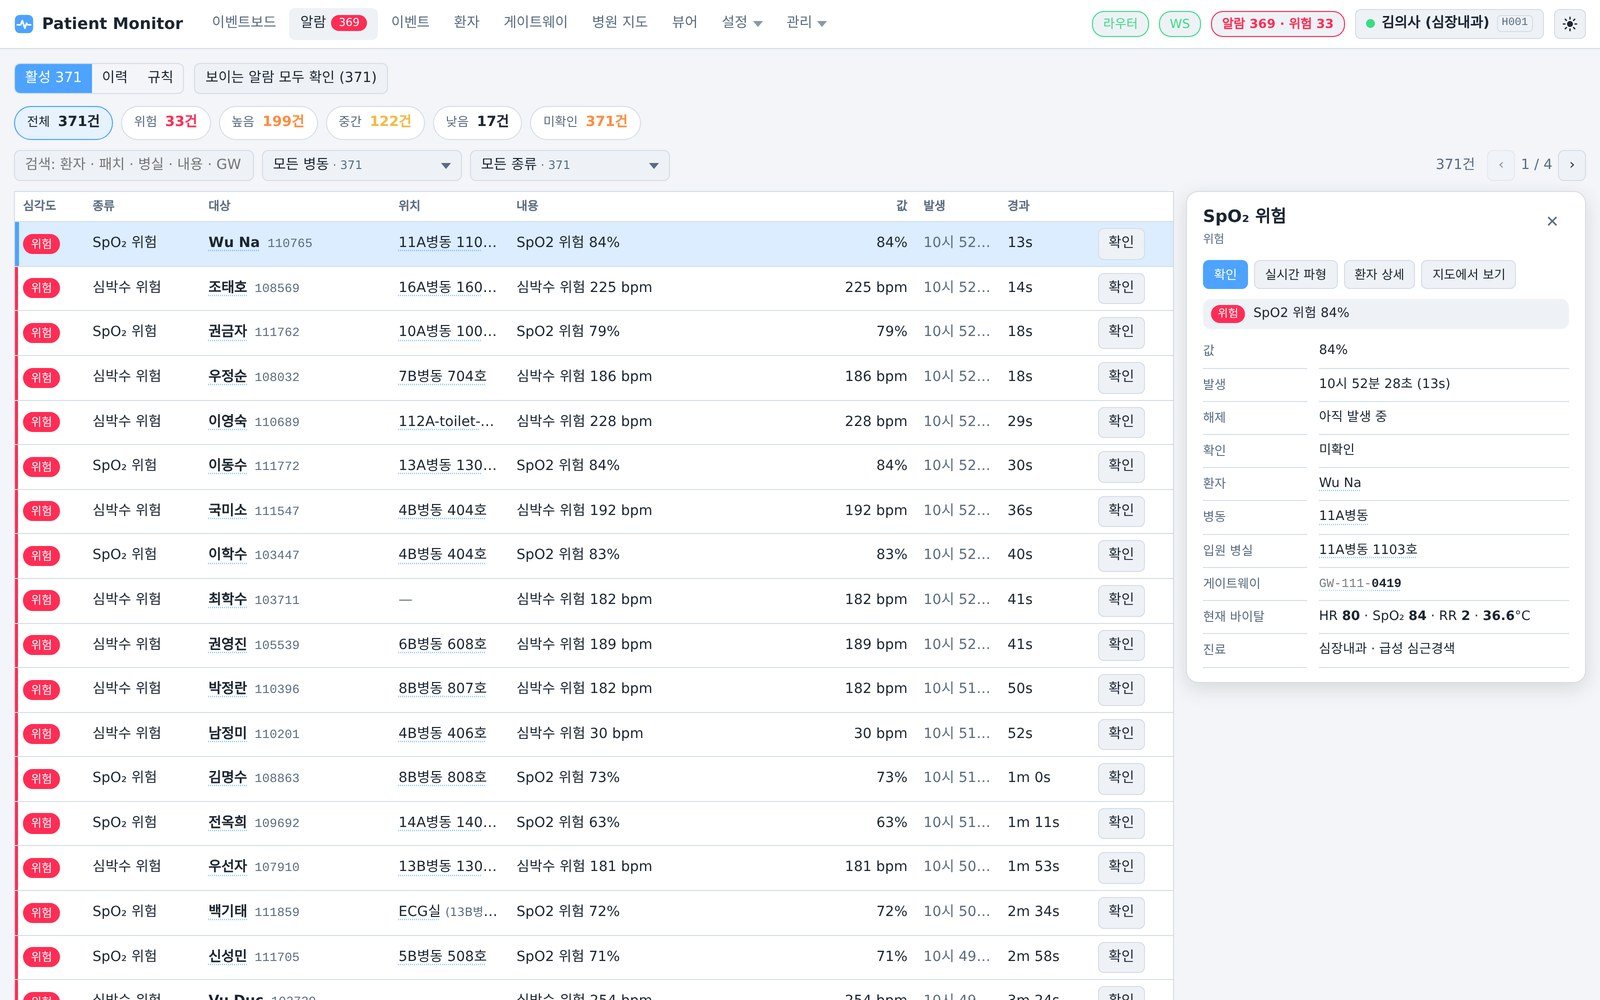
Alarms
Thresholds for heart rate, SpO₂, respiration and temperature, lead-off, low battery, unresponsive patches and gateway drop-outs, at four severity levels.
- Severity and unacknowledged chips, ward and type filters
- Selecting a row shows current vitals with acknowledge, live-waveform and map buttons
-
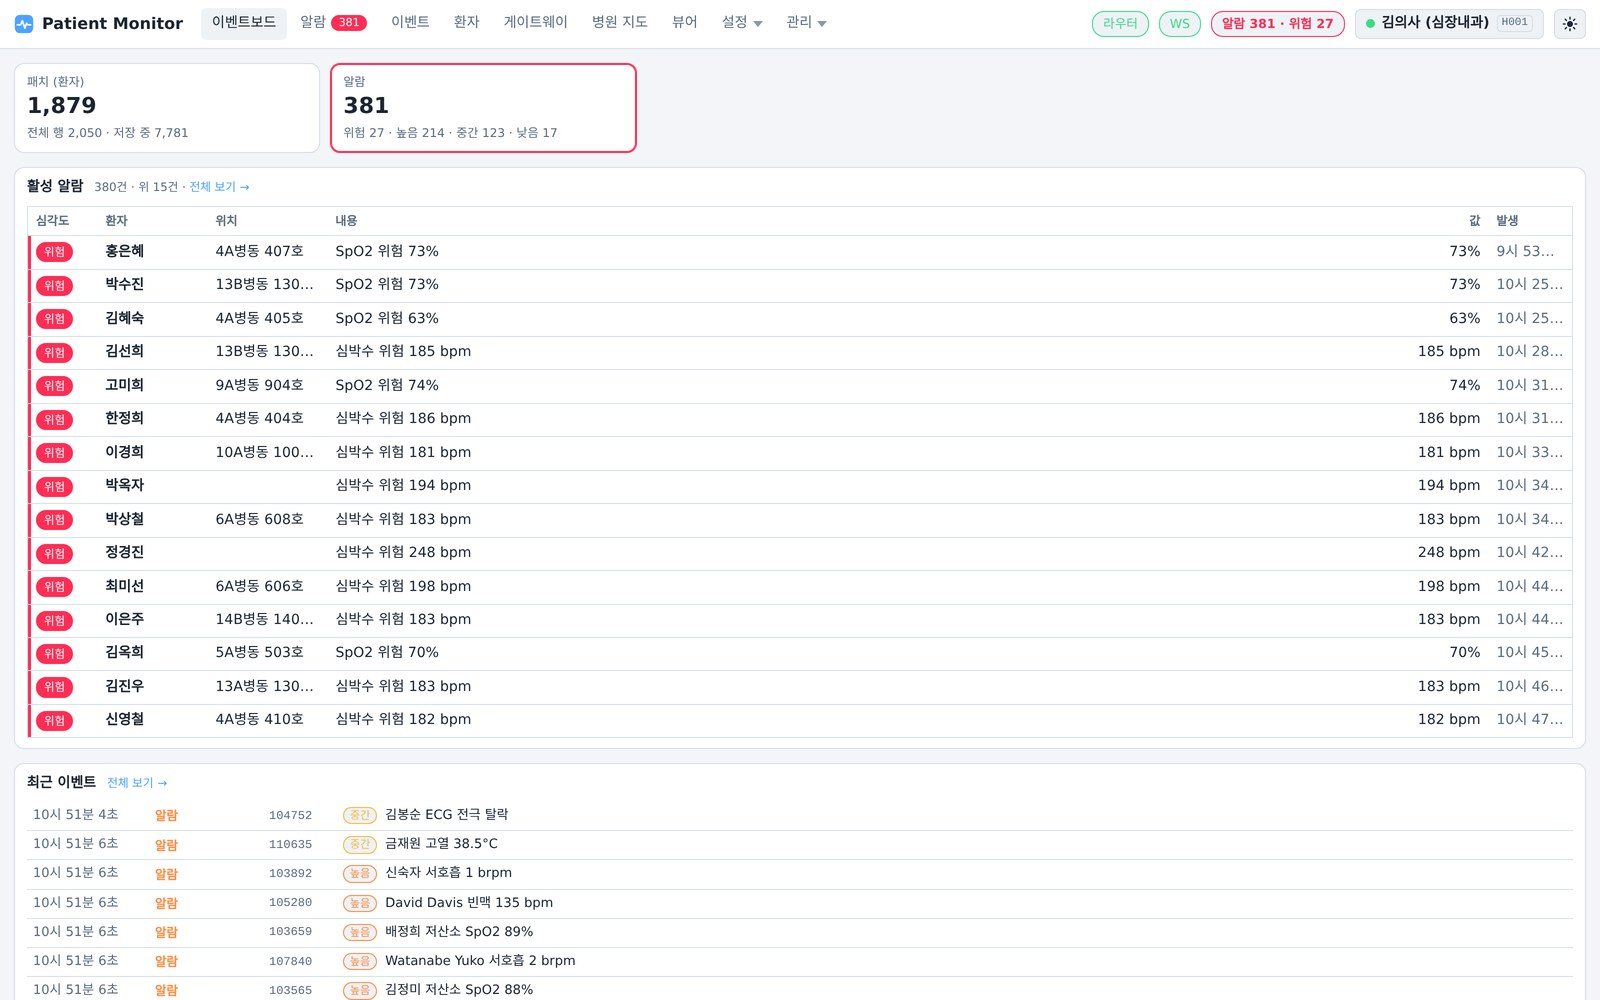
05 / 15
Event board
Alarms sounding now and recent events at a glance.
-
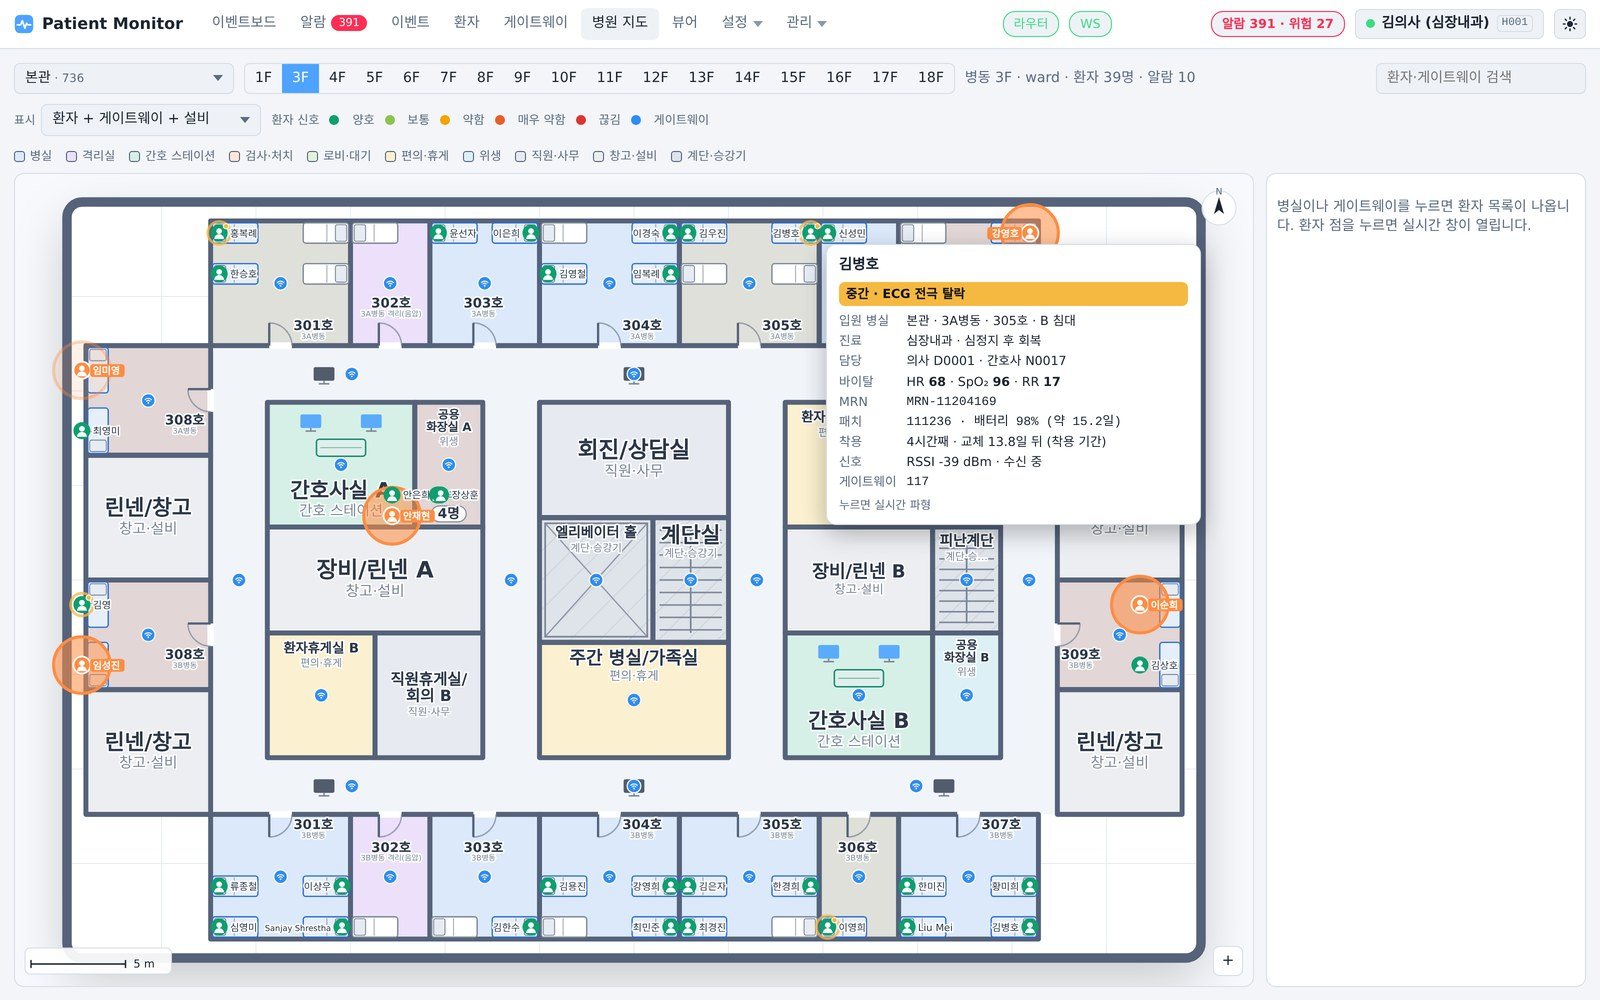
06 / 15
Hospital map
Patients, gateways and alarms overlaid on floor plans by building and floor.
- High and critical alarms marked with alarm-coloured circles
- Hover for an info tip, click to open the live window
- "Show on map" from any screen jumps to the floor and highlights for 5 seconds
-
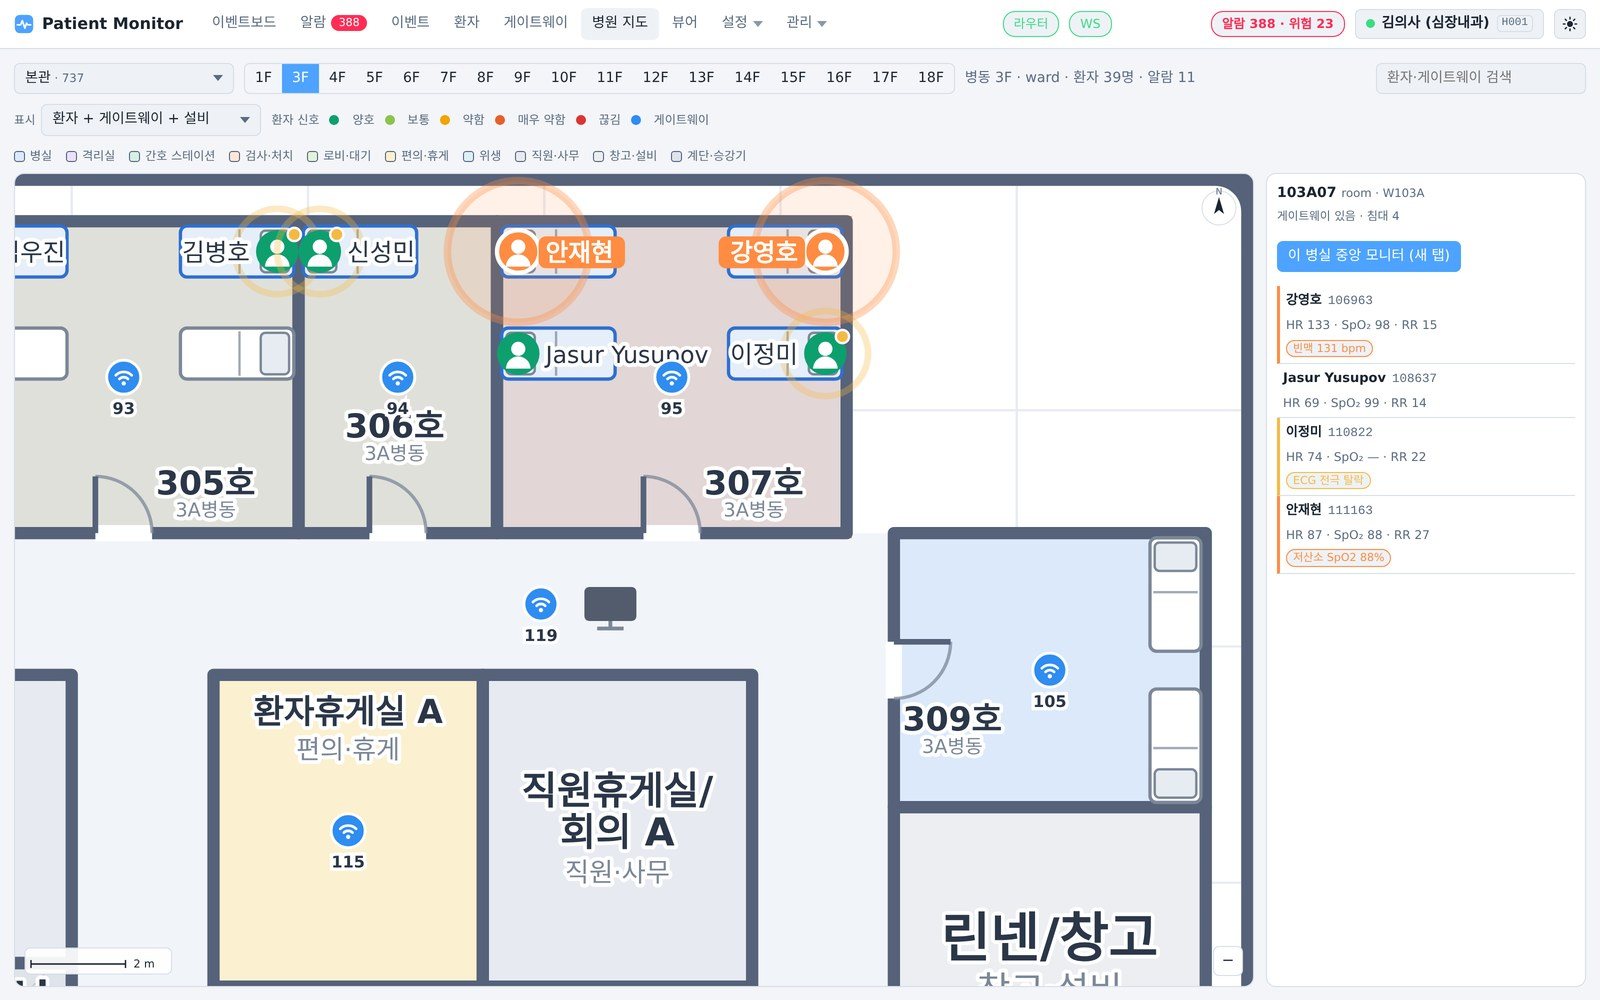
07 / 15
Room zoom
Clicking a room lists its patients and offers a room central-monitor button.
-
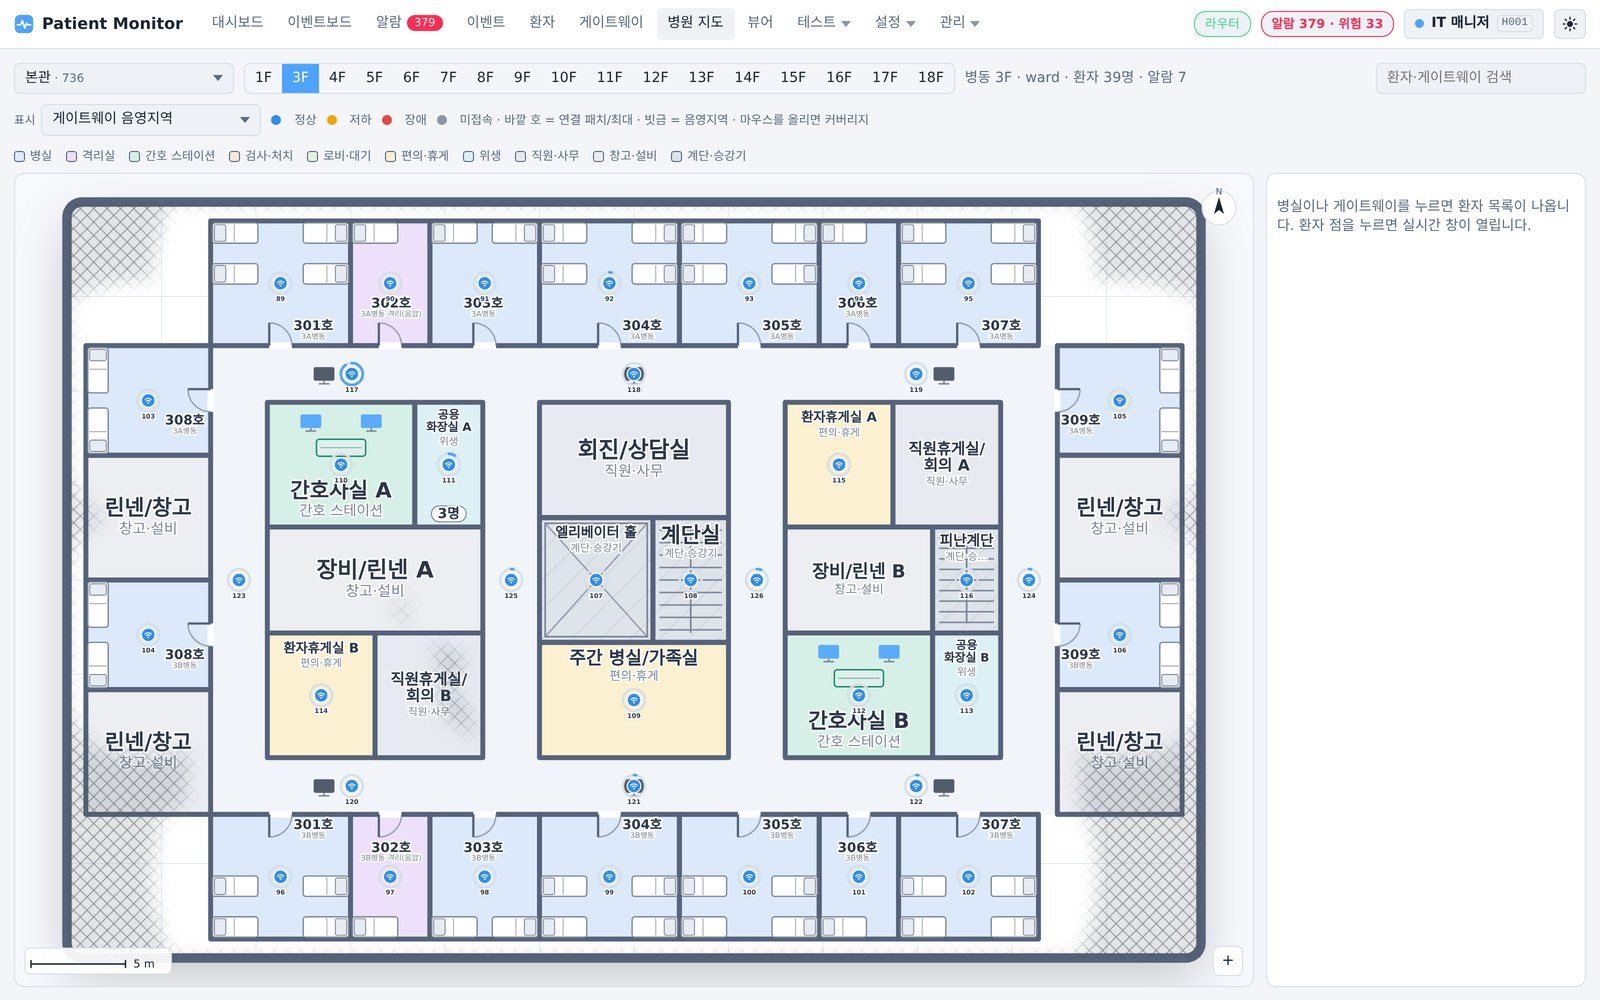
08 / 15
Gateway dead zones
Gateway coverage and dead zones on the floor plan; a dark theme is available too.
-
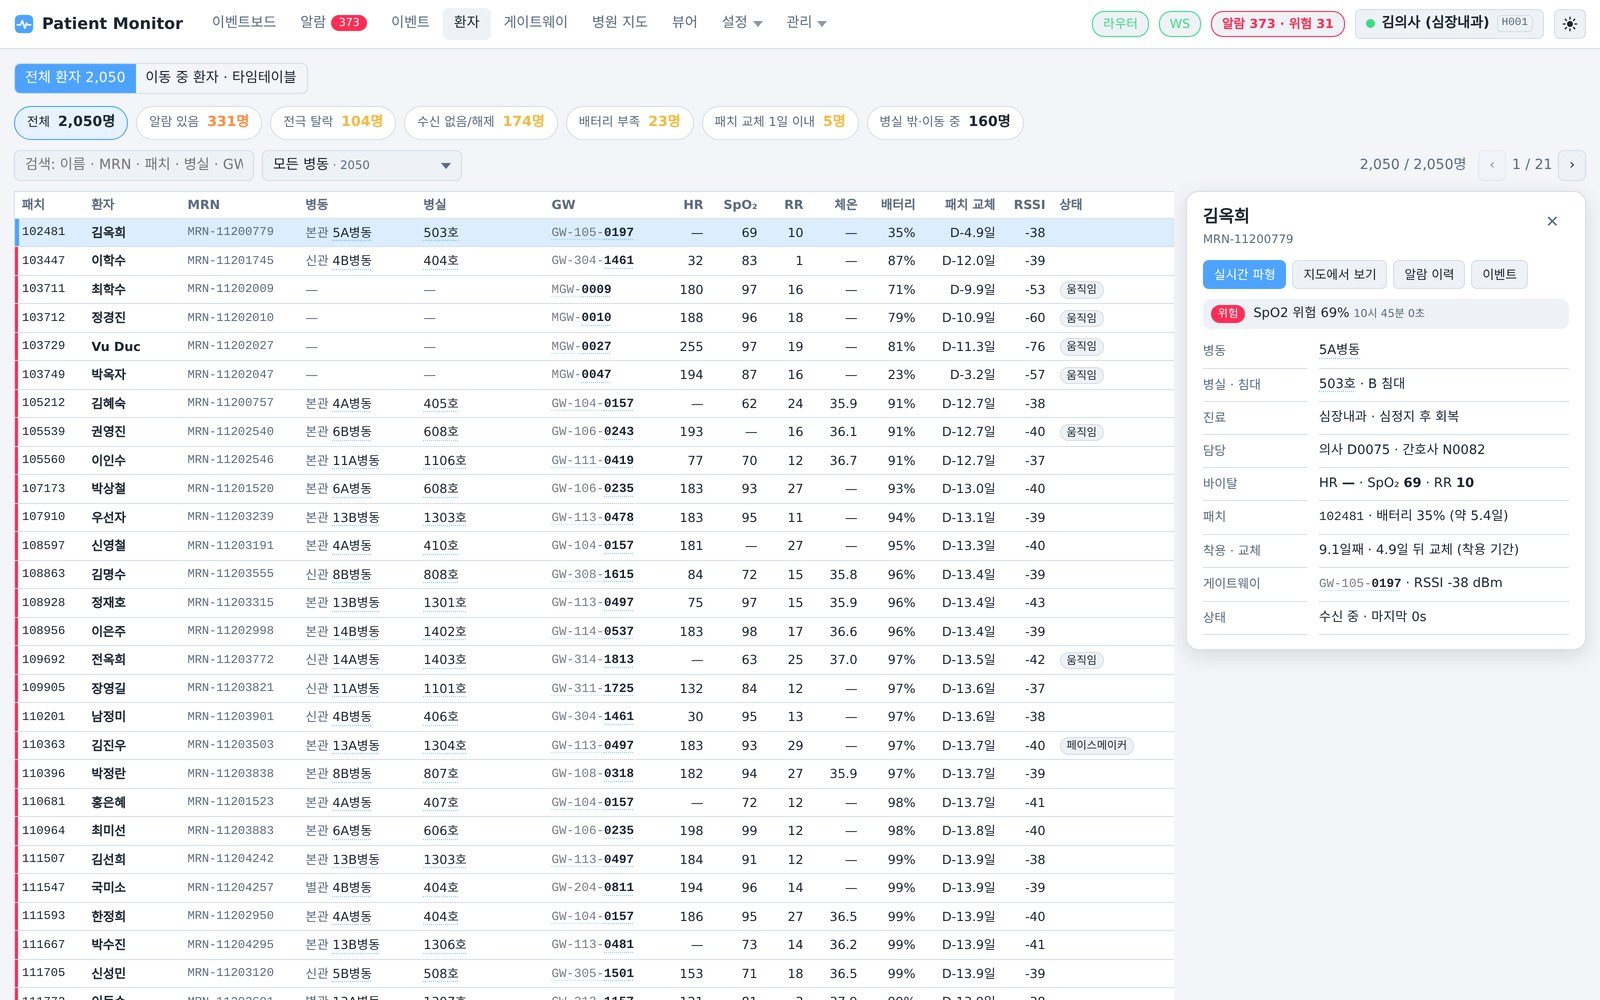
09 / 15
Patient list
Chips filter the patients who need attention.
- Alarm, lead-off, no signal, low battery, patch change due within a day, out of room
- Wards, rooms and gateways link to each other
-
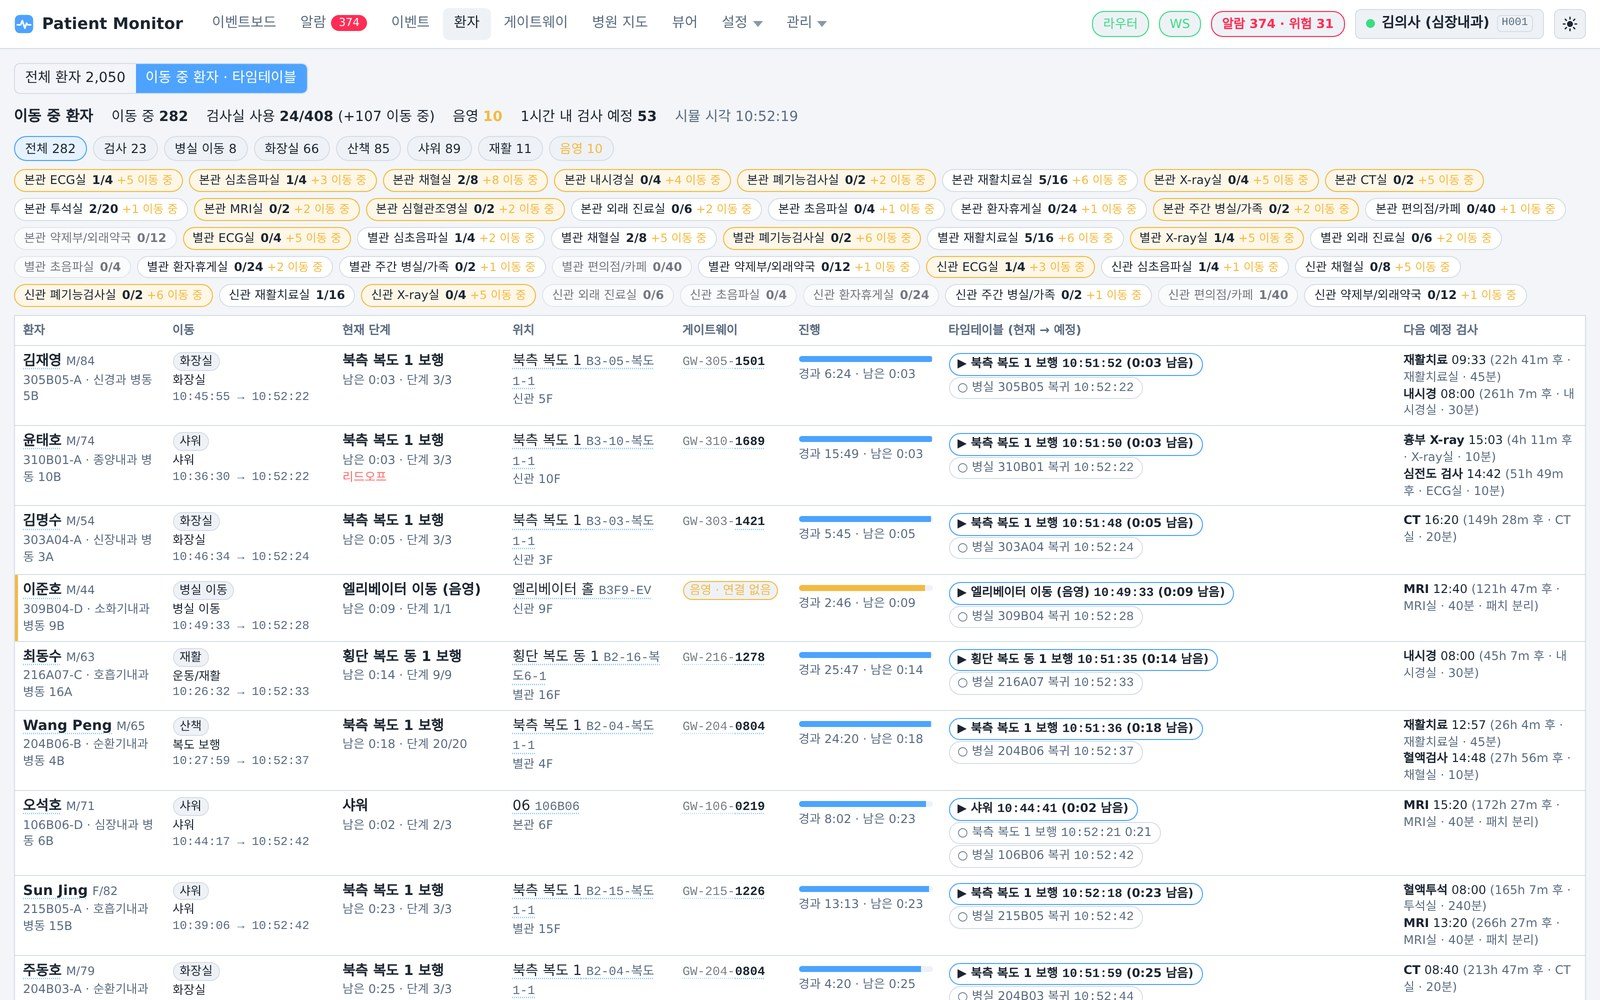
10 / 15
Patients in transit
Patients who left their room for exams, rehab or dialysis, with current step, progress and the step-by-step schedule.
- Next scheduled exam and usage by exam room
- Replacement reminders based on 14 days of wear and about 15.5 days of battery
-
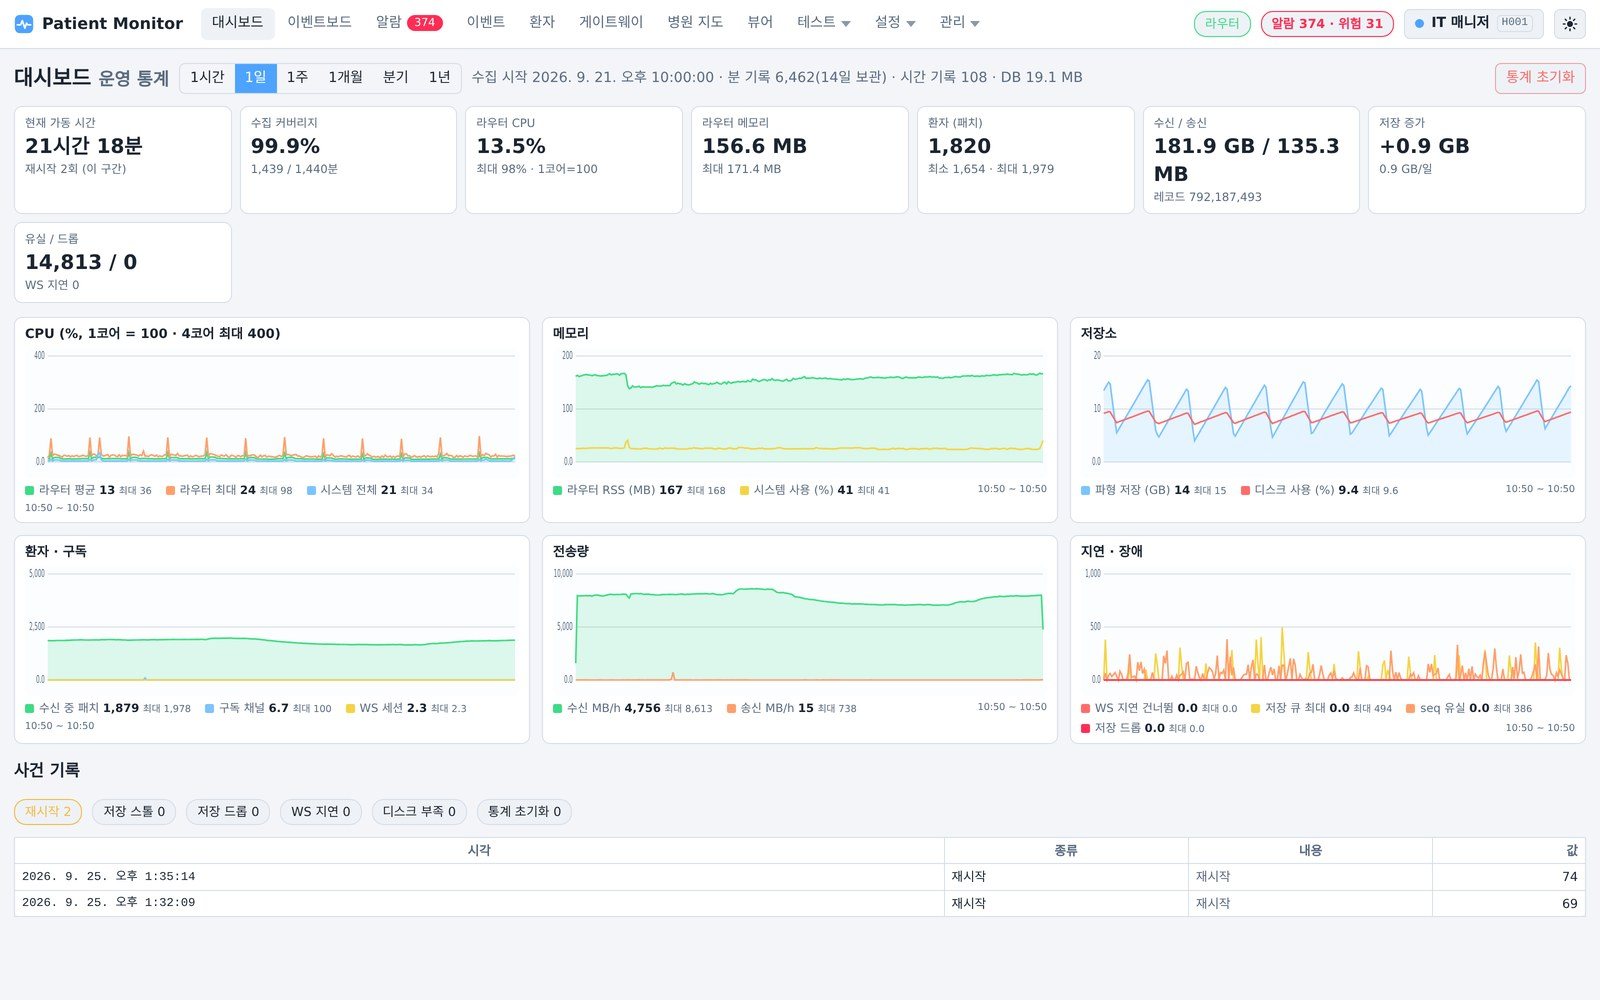
11 / 15
Operations dashboard
CPU, memory, storage, intake, loss and restarts, from one hour to one year.
- Recorded per minute; summarised hourly after 14 days
-
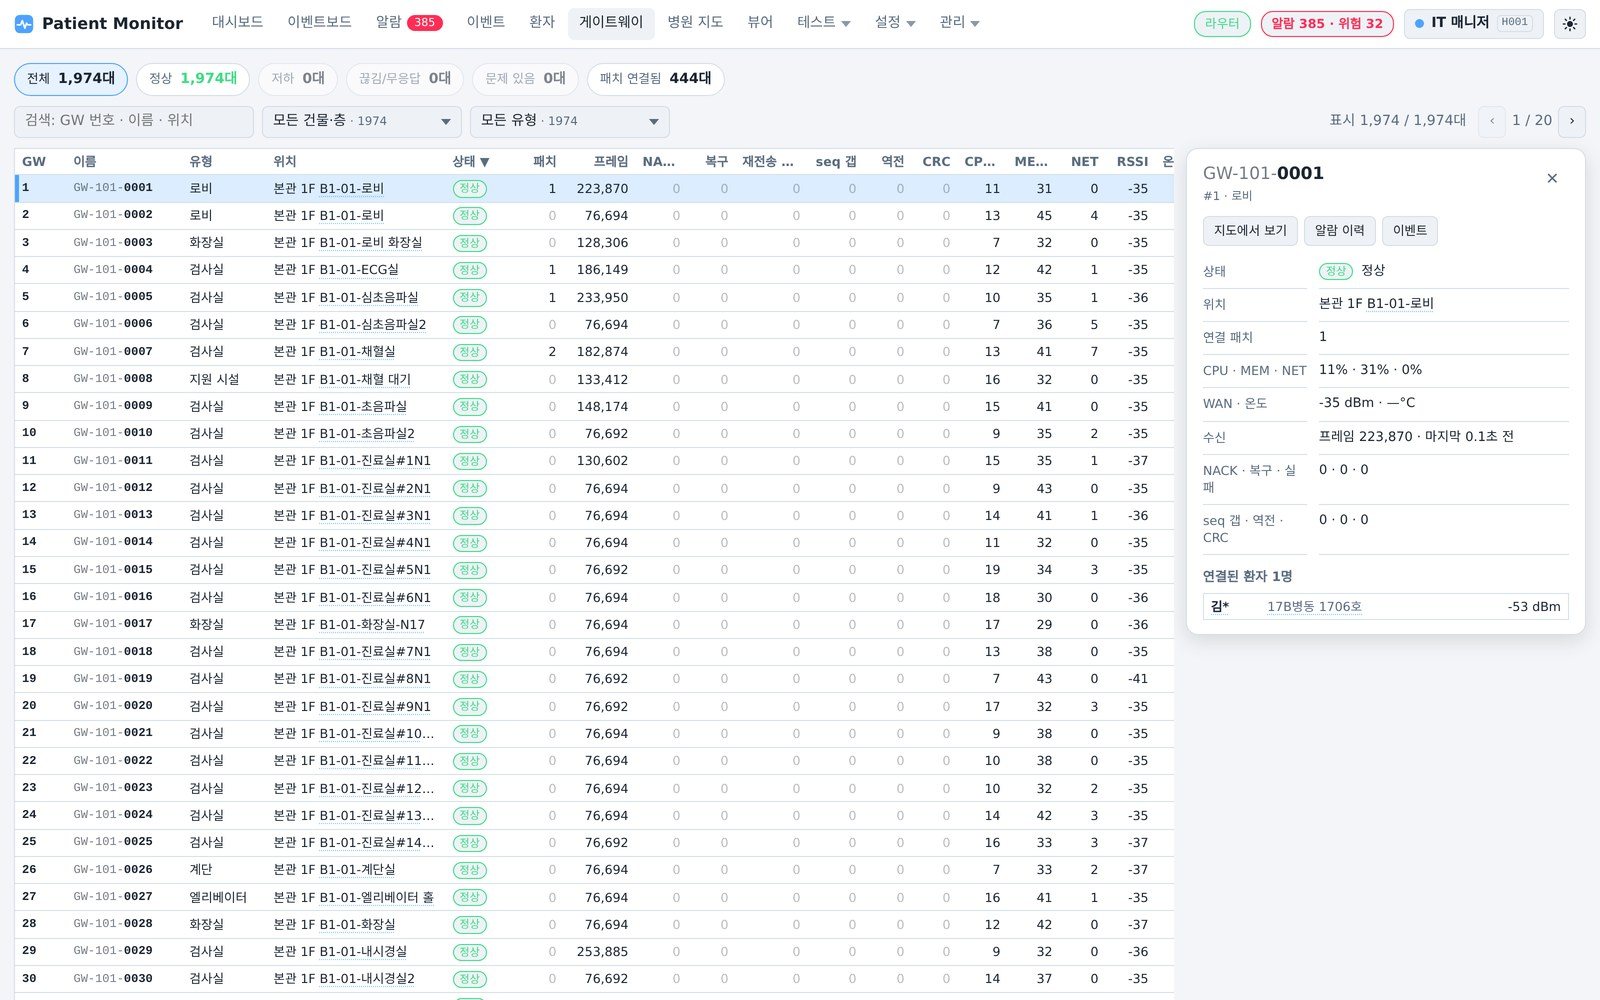
12 / 15
Gateways
Gateway status and load.
- Normal, degraded and disconnected chips; building, floor and type filters
- Per-gateway load, retransmission and CRC statistics with connected patients
-
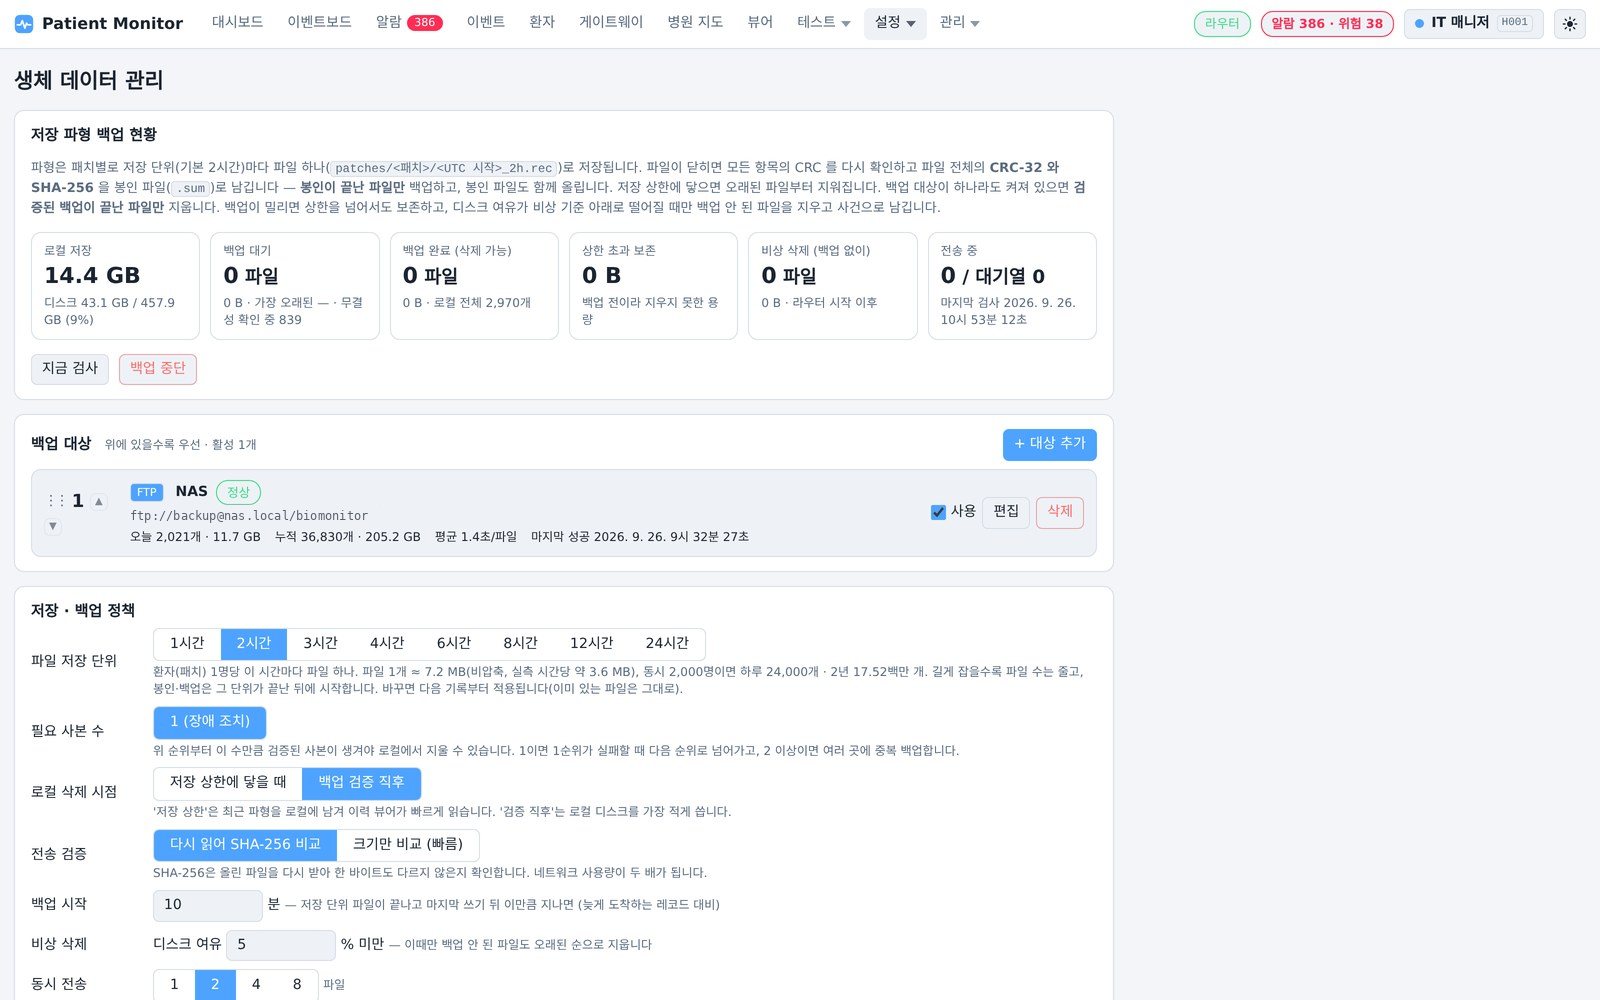
13 / 15
Storage and backup
Waveforms are stored per patient, sealed for integrity, then backed up.
- One file per patient (patch) every 2 hours (1–24 h selectable)
- Per-record CRC plus a CRC-32 and SHA-256 seal per file
- Backup to NAS, SMB, FTP, FTPS or SFTP, re-read remotely and checked by SHA-256
-
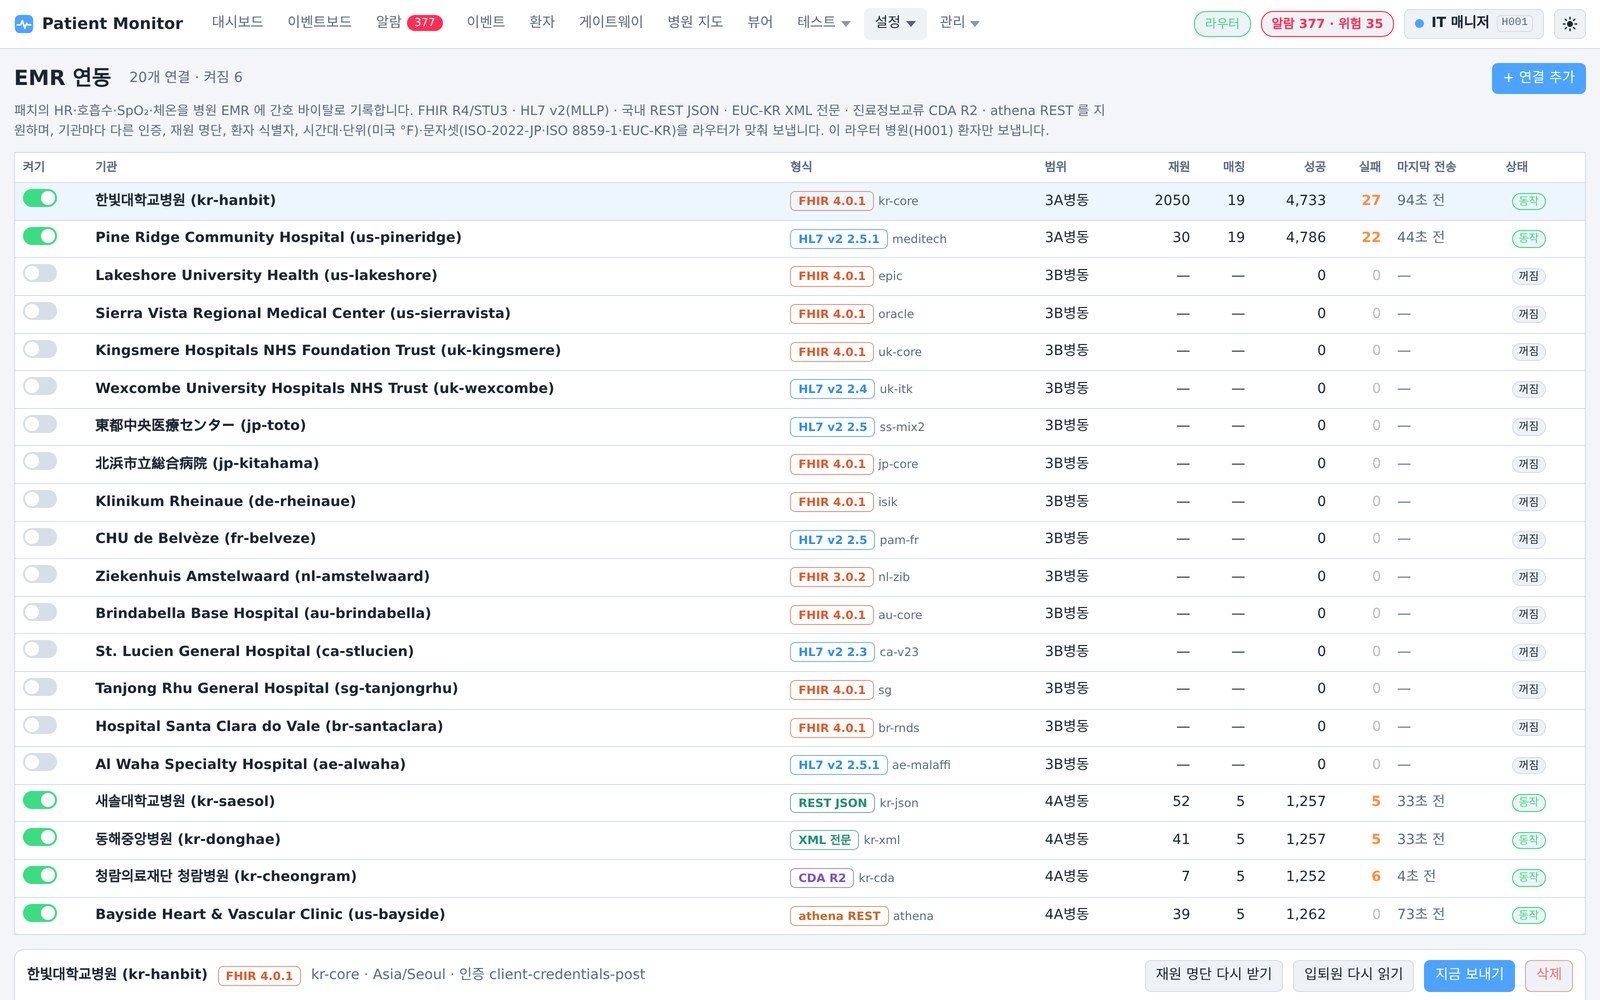
14 / 15
EMR integration
Census and admissions/discharges arrive in real time to match patients, and vitals are written back in each EMR's format.
- FHIR R4/STU3, HL7 v2 (MLLP), Korean EMR JSON, EUC-KR XML and CDA R2, REST
- Validated against 20 simulated hospital sites in Korea and abroad
-
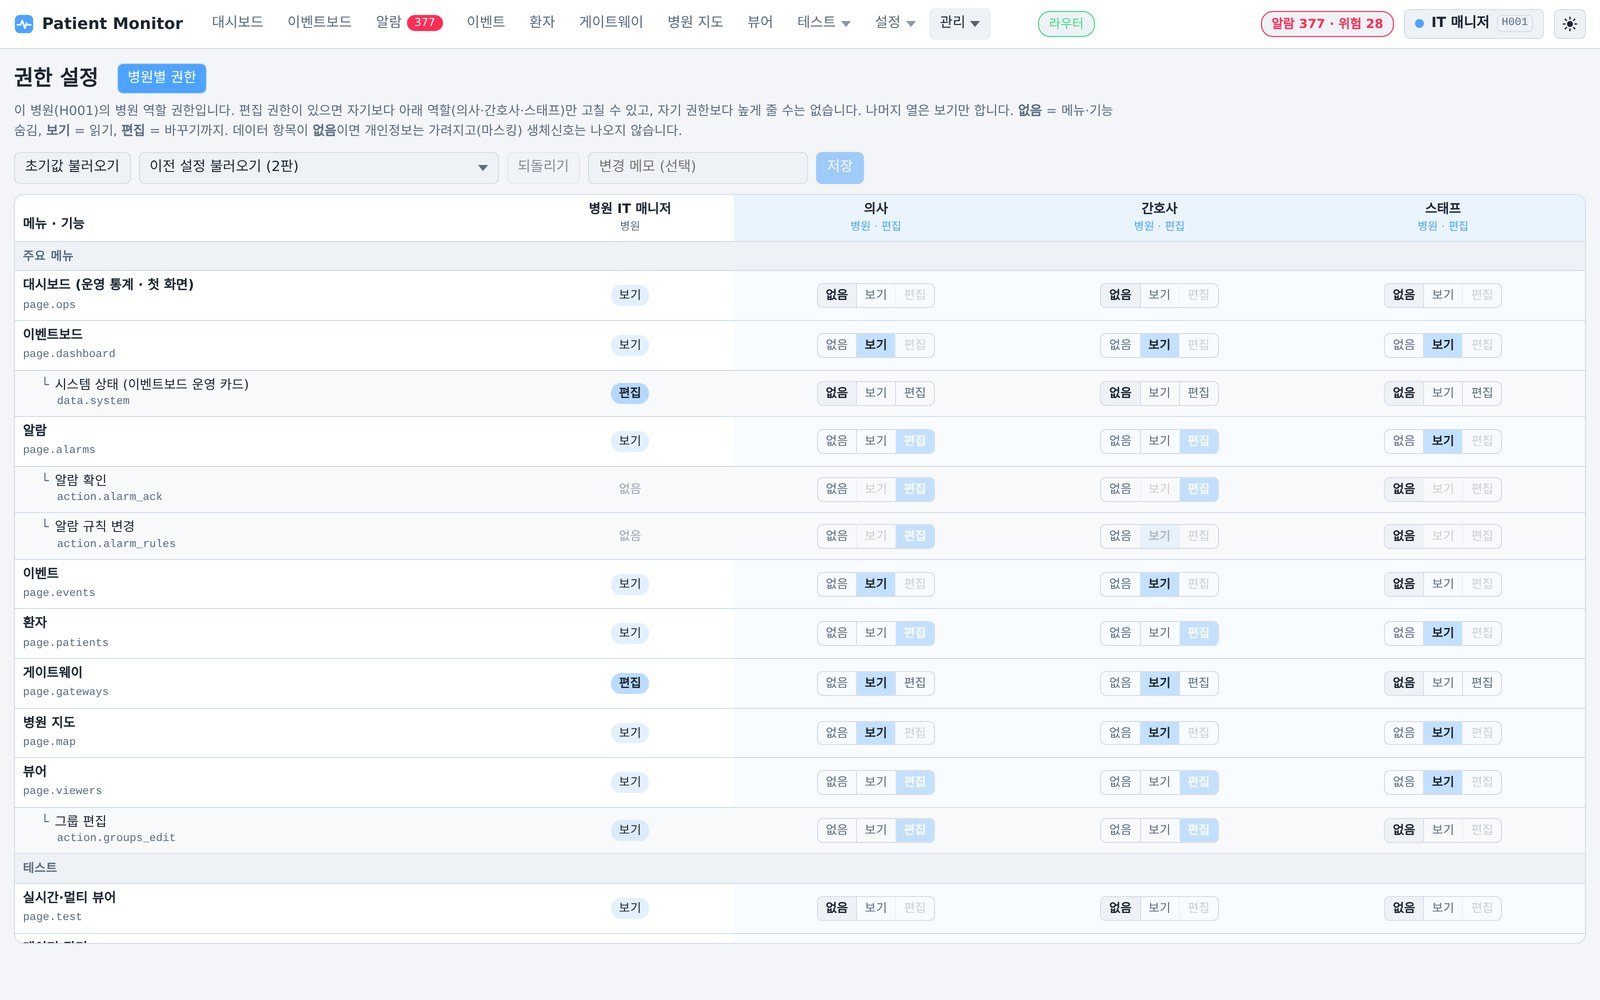
15 / 15
Accounts and permissions
Permissions from menus to in-screen functions to data fields, set to none, view or edit.
- Eight roles; each can only change roles below its own
- Without permission, the server masks personal data and omits vital signs
- Data separated per hospital (tenant), with audit records
Measured
Operating-scale results
Load-test figures measured with Bio-Signal Emulator (September 2026, one small desktop computer, 4 cores, 4 GB; about 150–176 MB of memory). Not yet validated in a real hospital.
Specifications
Key specifications
| Channels | ECG 250 Hz, 3-axis acceleration 50 Hz, PPG 100 Hz, respiration waveform 25 Hz; heart rate, respiration rate, SpO₂, temperature and glucose once per second; pacemaker spikes |
|---|---|
| Tested scale | 2,100 patients · about 2,000 gateways · about 11,000 records per second |
| Server load | About 12.5% of one core on a small desktop computer (4 cores, 4 GB); about 150–176 MB of memory |
| Transport | One TCP connection per gateway, 200 ms frames, CRC-32, retransmission requests for missing frames |
| Storage | About 3.6 MB per patient-hour uncompressed; about 57% with gzip |
| Integrity | CRC-32 per record, CRC-32 and SHA-256 seal per file, SHA-256 checks on backup and restore |
| Backup | NAS · SMB · FTP · FTPS · SFTP, 1–8 copies |
| EMR | FHIR R4/STU3, HL7 v2 MLLP, Korean JSON/XML/CDA, REST |
| Interface | Web browser (light and dark themes), full-screen central monitor and bedside viewer |
Talk to us
Let's review what adopting this solution would cover.